

Calculation Designer: Custom KPIs
Custom KPIs can be used to create scorecards and to provide powerful analytic insights for identifying trends and viewing double metrics, as well as other functionalities. Custom KPIs can be displayed within grid cells as mini In-Grid KPI icons or as larger Gauge graphics (or using both in parallel). Custom KPIs involve the following items:
- Actual values.
- Target values.
- Status values that compare actual results to target results.
- Powerful visualizations.
NOTE: Microsoft based KPIs are designed in the data model or cube - and reflect actual, target, status and trend values. BI Office offers Custom KPIs from its Advanced Calculation Designer which extends this concept with deeper logic options, dynamic banding, more settings for visualization, and an easier interface for designing classic KPIs.
Accessing the Custom KPI Interface
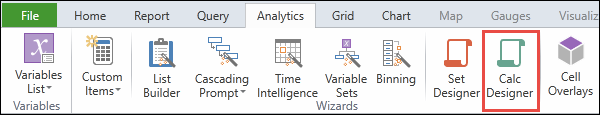
To create Custom KPIs, open the Analytics ribbon (in Data Discovery) and click on Calc Designer.
The ACD window is displayed.
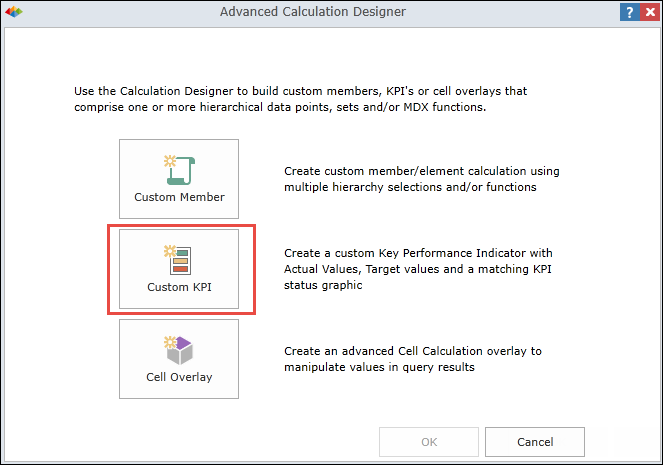
Click the “Custom KPI” option to open the Custom KPI dialog (shown below).
NOTE: To edit an existing Custom KPI, right click it in the custom elements folder and select the "Edit in KPI Designer" command.
Building a Custom KPI
Building a Custom KPI involves three simple steps:
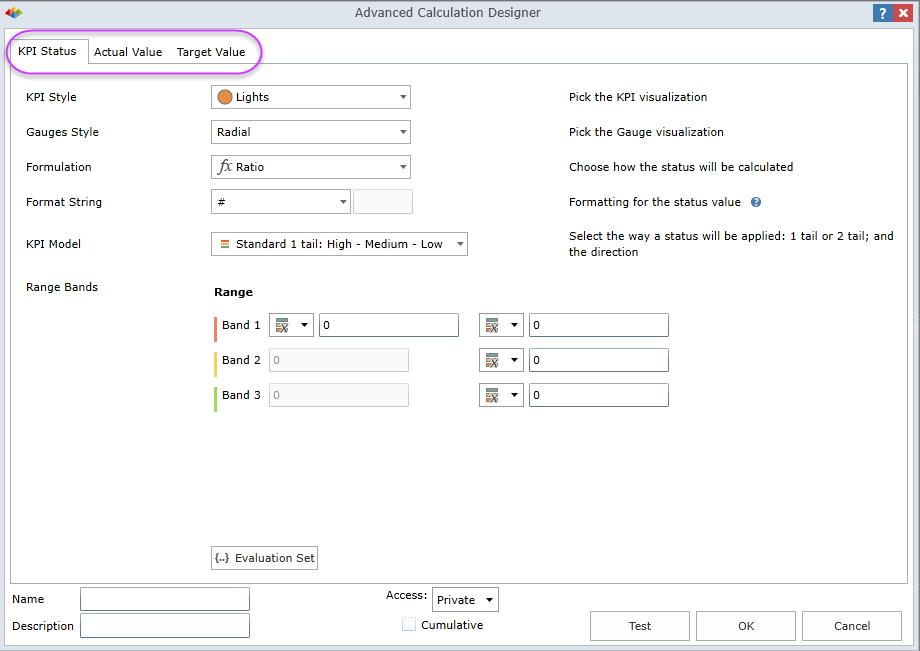
KPI Status
The logic for the KPI calculations and the graphical representation of the KPI. The term “Status” refers to how the actual results compare to the target results.
Actual Value
The value representing the level of actual performance. Refer to the custom members section for details on how to define members/calculations.
Target Value
The intended target of performance against which the actual is to be measured. Refer to custom members section for details on how to define members/calculations.
NOTE: The core elements of the KPI use the same logic as custom members. It is recommended that you read about custom member design before proceeding.
KPI Design and Status Logic
Use the following fields to set the KPI status:
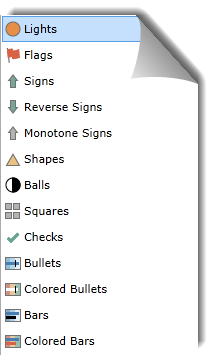
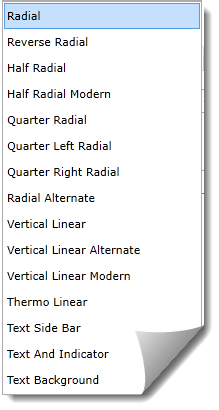
KPI Style
Choose the icon that will be used as your in-grid KPI style.
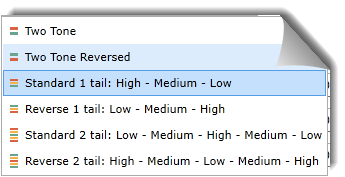
Gauges Style
Pick the desired gauge type:
Formulation
The wizard provides five standard formulas plus a custom option. The formula you choose will be used to generate the status value.
- Ratio: Actual/Target
- Reverse Ratio: Target/Actual
- Growth Percentage: (Actual-Target)/Target
- Variance Percentage: (Actual-Target)/Actual
- Difference: Actual-Target
- Custom Formulation: Build a custom equation using “[A]” and “[T]” to designate the actual and target input values.
Format String
Determine the format mask to be used for displaying the KPI status value.
KPI Model
Choose the number of bands (2/3/5) to be used for the gauge display.
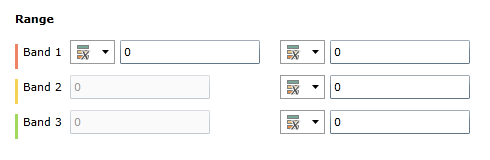
Range Bands:
Define the individual ranges for the KPI model. The number of bands is determined by the KPI Model selection. The ranges will affect the KPI color display. Range bands can be set with static values or by combining dynamic values with logic statements. Read more regarding Dynamic KPI Bands.
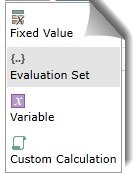
For each band value, the choices are as follows.
KPI Meta Data
Fill in the Metadata panel at the bottom of the dialog:

- Provide a Name and Description for your Custom KPI.
- Use the Access field to determine Security and Access permissions.
- Use Test to try out the calculation syntax.
- If correct, you will receive the “Query Passed” message.
- If incorrect, you will receive an error message.
- Check Cumulative to enable users to multi-select and combine columns and/or rows for query outcomes (when using parameters).
Click OK to save your Custom KPI.
Home |
Table of Contents |
Index |
User Community
Pyramid Analytics © 2011-2022